20 June 2025
Ethereum is approaching a critical test as price action tightens, setting the stage for a decisive move above key demand. After weeks of volatile yet controlled trading, bulls are attempting to reclaim higher ground, but momentum remains limited. At the same time, bears have repeatedly failed to drive ETH below the $2,400 level, reinforcing it as a strong support zone for now. With global markets under pressure from geopolitical tensions and macro uncertainty, Ethereum’s next move could define the direction of the broader altcoin market.
Top analyst M-log1 believes the ETH/BTC pair is the most important chart to monitor in the coming days. According to his view, a breakout—either to the upside or downside—will determine the fate of altcoins across the board. The setup has reached an inflection point after multiple tests of the lower support band, with bulls continuing to defend it against breakdown attempts.
This consolidation phase, combined with suppressed volatility and rising macro tension, makes Ethereum’s current structure one of the most significant technical formations in crypto right now. All eyes are now on ETH/BTC as traders prepare for what could be a defining moment in the altcoin cycle.
Ethereum Builds Pressure As Breakout Nears
Ethereum continues to trade within a narrow range that began in early May, hovering between the $2,400 and $2,800 levels. This prolonged consolidation comes at a time of growing geopolitical instability, as the conflict in the Middle East escalates and macroeconomic uncertainty grips global markets. While many investors had anticipated an altseason by now, that rotation of capital into altcoins has yet to materialize. All eyes remain on Ethereum to serve as the catalyst for that next leg higher.
M-log1 believes the ETH/BTC pair holds the most important signal in the coming days. “This is probably the most important chart you want to keep an eye on,” he stated, highlighting that whichever direction ETH/BTC breaks could determine the fate of the altcoin market.
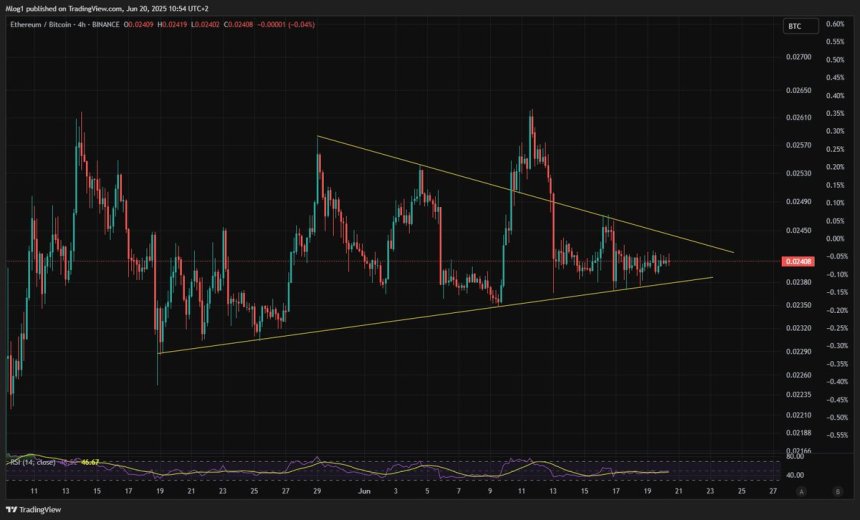
The chart has repeatedly tested the lower support range, with bulls successfully defending that level on at least eight occasions. According to M-log1, this persistent defense suggests that bears are losing momentum, and a breakout to the upside is more likely. “I am 80/20 in favor of the upside,” he said, citing the market’s inability to break lower as a sign of underlying strength.
ETH Tests Weekly Moving Averages
Ethereum (ETH) is currently trading at $2,550, maintaining its position above all major weekly moving averages—50, 100, and 200. This level marks a key technical pivot as price consolidates between $2,450 and $2,680 after a strong recovery from its April low near $1,500. Despite multiple attempts to break higher, ETH continues to face resistance just below the $2,700 mark, showing that sellers remain active near historical supply zones.
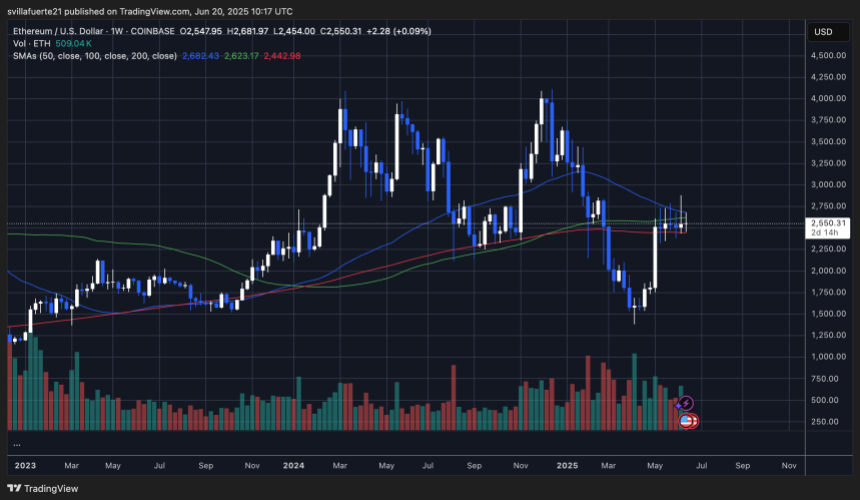
Importantly, the recent weekly candles have held the 100-week and 200-week simple moving averages as support. This indicates structural strength, especially considering the broader macro uncertainty driven by Middle East tensions and tighter U.S. monetary policy. Volume remains steady, with no signs of panic selling, further supporting the idea that ETH is stabilizing.
The current compression in price around key moving averages typically precedes a larger directional move. A confirmed weekly close above $2,700 could open the door to a rapid push toward the psychological $3,000 level. Conversely, losing the $2,400 support would likely trigger a short-term correction back toward the 50-week SMA near $2,289.
Featured image from Dall-E, chart from TradingView