6 August 2025
Dogecoin started a fresh decline from the $0.2120 zone against the US Dollar. DOGE is now consolidating and might decline below the $0.1940 support.
- DOGE price started a fresh decline below the $0.2050 level.
- The price is trading below the $0.20 level and the 100-hourly simple moving average.
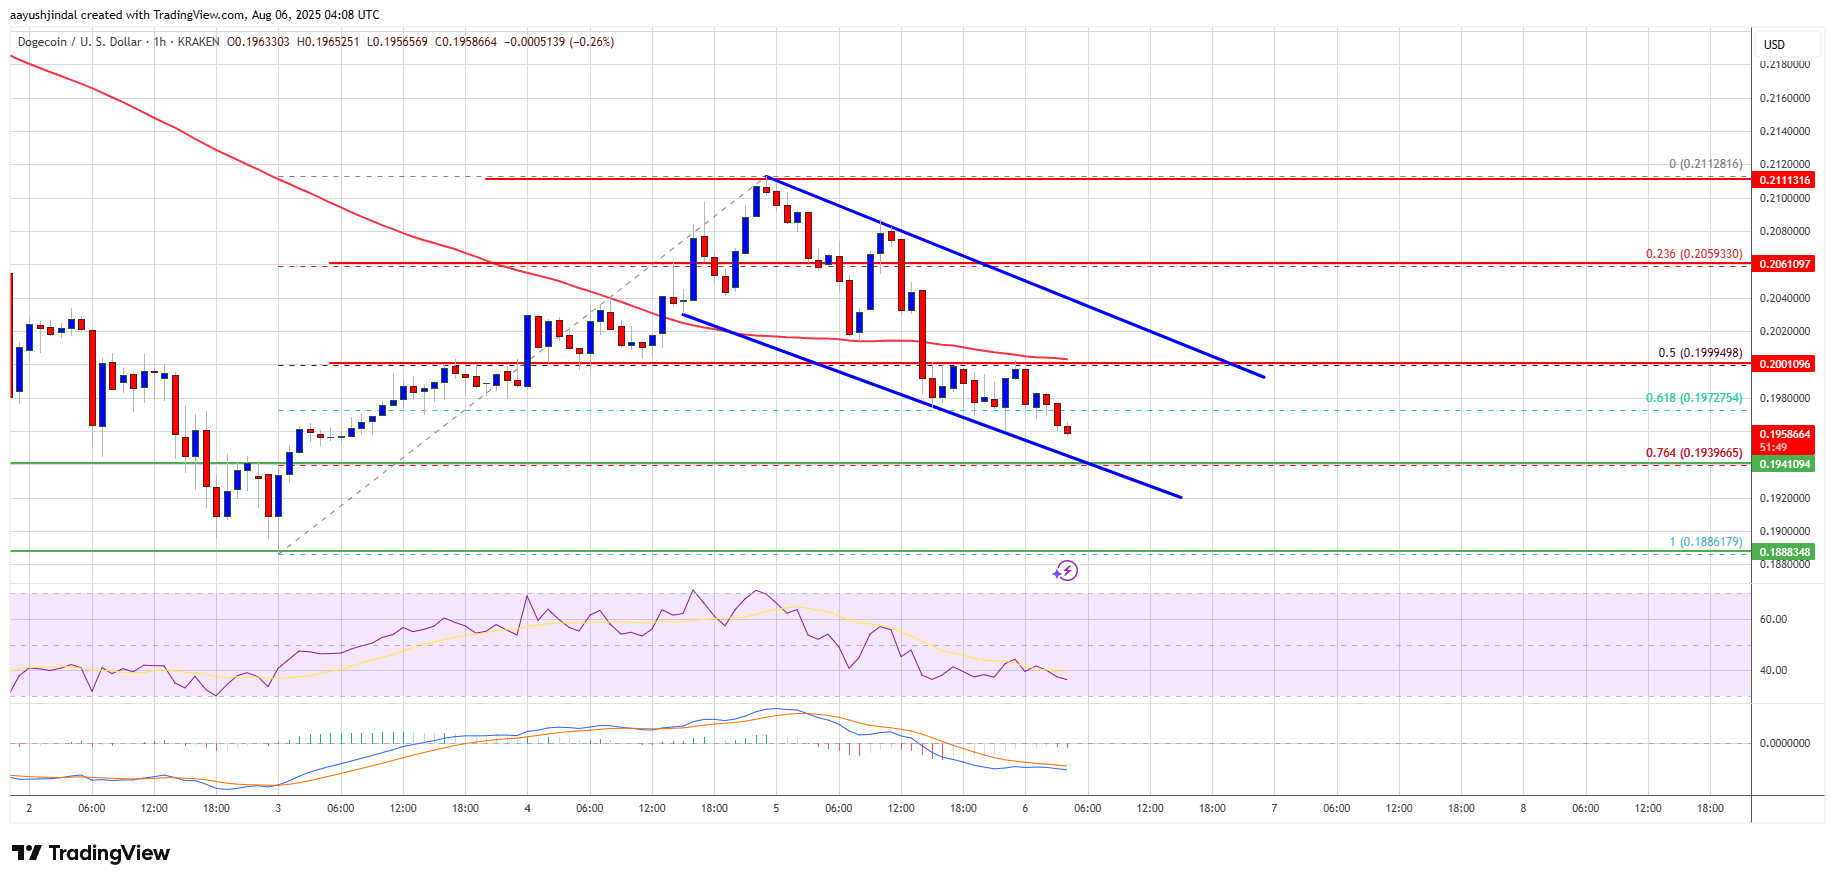
- There is a key declining channel forming with resistance at $0.20 on the hourly chart of the DOGE/USD pair (data source from Kraken).
- The price could start a fresh upward move if it clears the $0.20 and $0.2050 resistance levels.
Dogecoin Price Dips Again
Dogecoin price started a fresh decline from the $0.2120 resistance zone, underperforming Bitcoin and Ethereum. DOGE declined below the $0.2050 and $0.20 support levels.
There was a steady decline below the 50% Fib retracement level of the upward move from the $0.1886 swing low to the $0.2112 high. The bears even pushed the price below the $0.1980 level. There is also a key declining channel forming with resistance at $0.20 on the hourly chart of the DOGE/USD pair.
Dogecoin price is now trading below the $0.1980 level and the 100-hourly simple moving average. Immediate resistance on the upside is near the $0.20 level. The first major resistance for the bulls could be near the $0.2050 level.
The next major resistance is near the $0.2120 level. A close above the $0.2120 resistance might send the price toward the $0.2250 resistance. Any more gains might send the price toward the $0.2350 level. The next major stop for the bulls might be $0.250.
More Losses In DOGE?
If DOGE’s price fails to climb above the $0.2050 level, it could start a fresh decline. Initial support on the downside is near the $0.1940 level or the 76.4% Fib retracement level of the upward move from the $0.1886 swing low to the $0.2112 high. The next major support is near the $0.1880 level.
The main support sits at $0.1750. If there is a downside break below the $0.1750 support, the price could decline further. In the stated case, the price might decline toward the $0.1680 level or even $0.1620 in the near term.
Technical Indicators
Hourly MACD – The MACD for DOGE/USD is now gaining momentum in the bearish zone.
Hourly RSI (Relative Strength Index) – The RSI for DOGE/USD is now below the 50 level.
Major Support Levels – $0.1940 and $0.1880.
Major Resistance Levels – $0.2000 and $0.2050.