27 January 2026
Bitcoin price started a recovery wave from $86,000. BTC is slowly moving higher and might rise further if it clears $89,500.
- Bitcoin started a minor recovery wave from the $86,000 level.
- The price is trading near $88,500 and the 100 hourly simple moving average.
- There was a break above a bearish trend line with resistance at $88,000 on the hourly chart of the BTC/USD pair (data feed from Kraken).
- The pair might recover if it manages to settle above $88,800 and $89,500.
Bitcoin Price Attempts Rebound
Bitcoin price extended losses and traded below the $87,200 support. BTC even declined below $86,500 before the bulls appeared. A low was formed at $86,007, and the price is now attempting a recovery wave.
The price climbed above the $87,000 and $87,500 levels. There was a move above the 50% Fib retracement level of the downward move from the $91,099 swing high to the $86,007 low. Besides, there was a break above a bearish trend line with resistance at $88,000 on the hourly chart of the BTC/USD pair.
Bitcoin is now trading near $88,500 and the 100 hourly simple moving average. If the price remains stable above $87,500, it could attempt a fresh increase. Immediate resistance is near the $88,800 level.
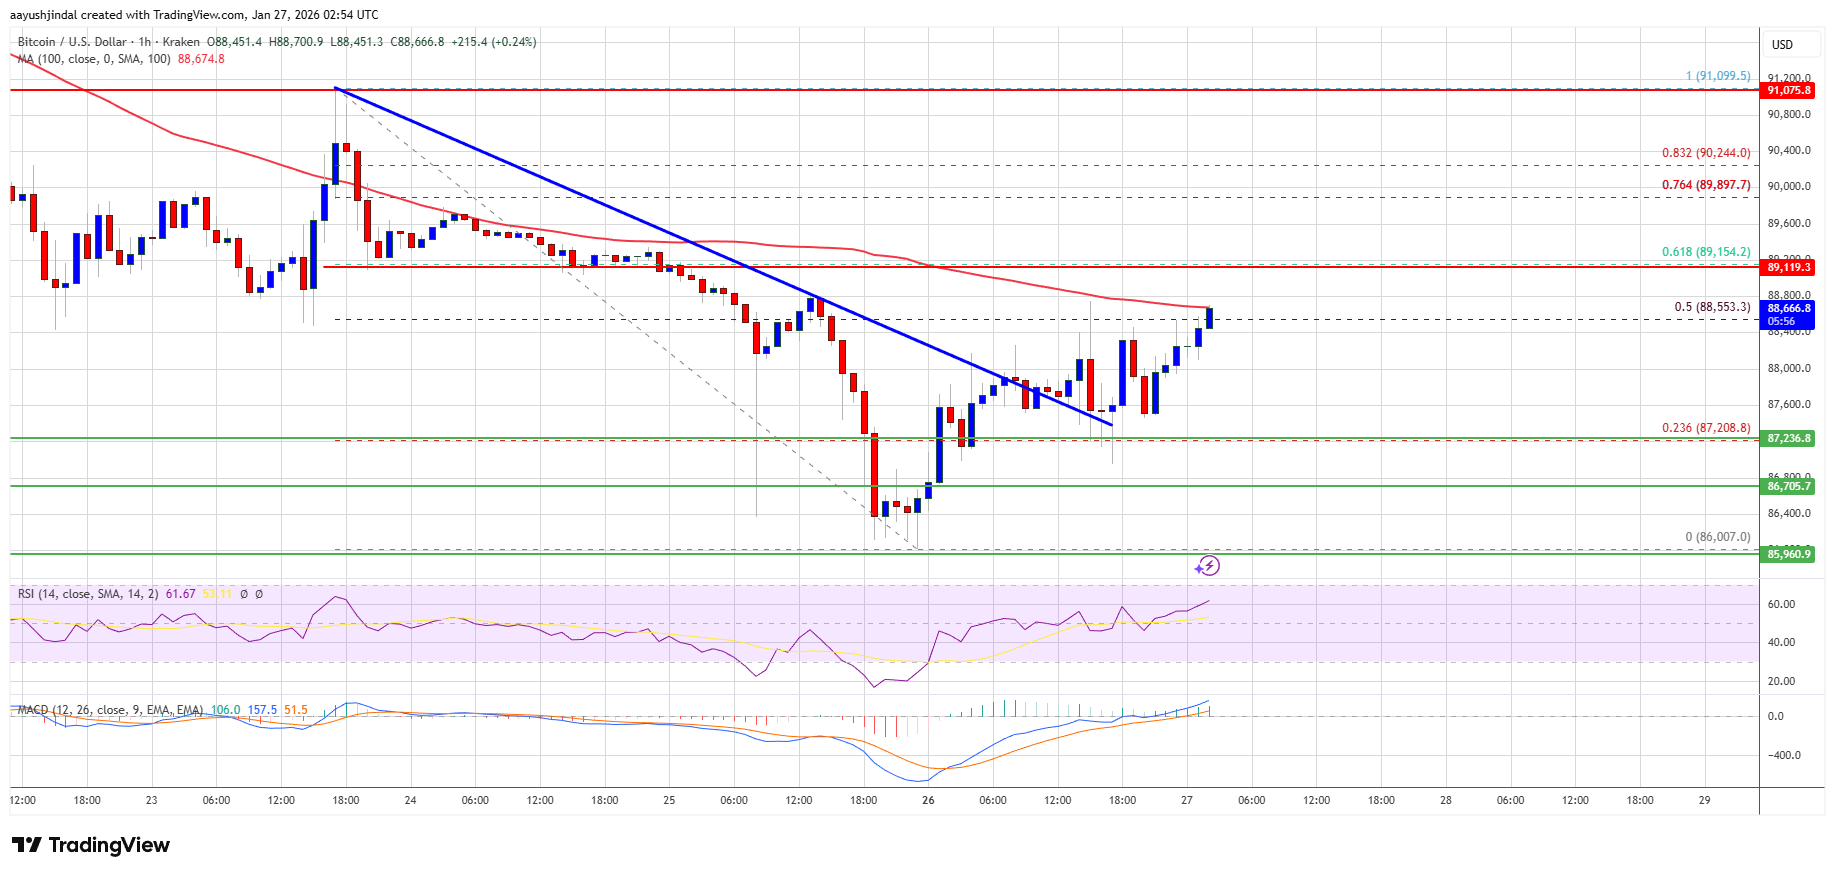
The first key resistance is near the $89,150 level since it is close to the 61.8% Fib retracement level of the downward move from the $91,099 swing high to the $86,007 low. A close above the $89,150 resistance might send the price further higher. In the stated case, the price could rise and test the $89,500 resistance. Any more gains might send the price toward the $90,000 level. The next barrier for the bulls could be $91,000 and $91,500.
Another Decline In BTC?
If Bitcoin fails to rise above the $88,800 resistance zone, it could start another decline. Immediate support is near the $88,000 level. The first major support is near the $87,200 level.
The next support is now near the $86,700 zone. Any more losses might send the price toward the $86,200 support in the near term. The main support sits at $86,000, below which BTC might struggle to recover in the near term.
Technical indicators:
Hourly MACD – The MACD is now gaining pace in the bullish zone.
Hourly RSI (Relative Strength Index) – The RSI for BTC/USD is now above the 50 level.
Major Support Levels – $88,000, followed by $87,200.
Major Resistance Levels – $88,800 and $89,500.