2 November 2024
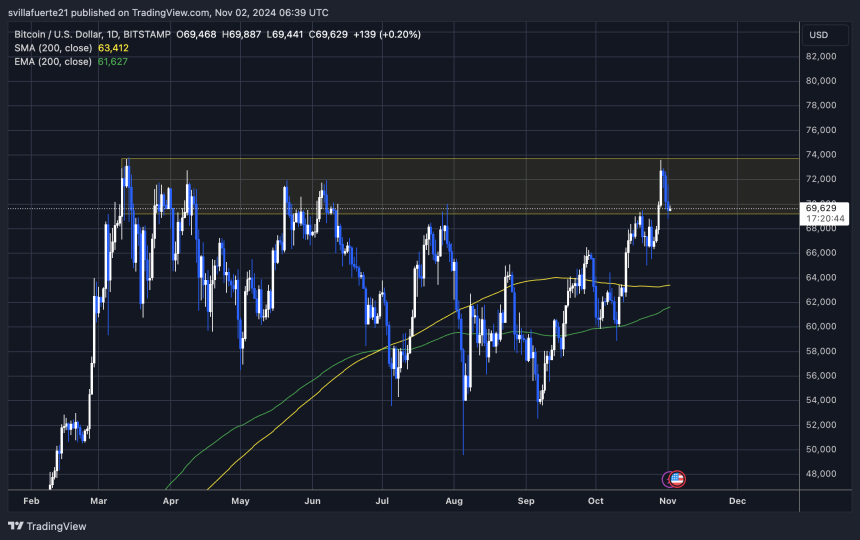
Bitcoin is showing resilience, holding firm above the $69,000 mark after a slight pullback from recent local highs at $73,600. Following weeks of bullish momentum and nearing its all-time high, BTC has settled just below the critical $73,794 resistance, a key level that, if surpassed, would push the cryptocurrency into price discovery mode.
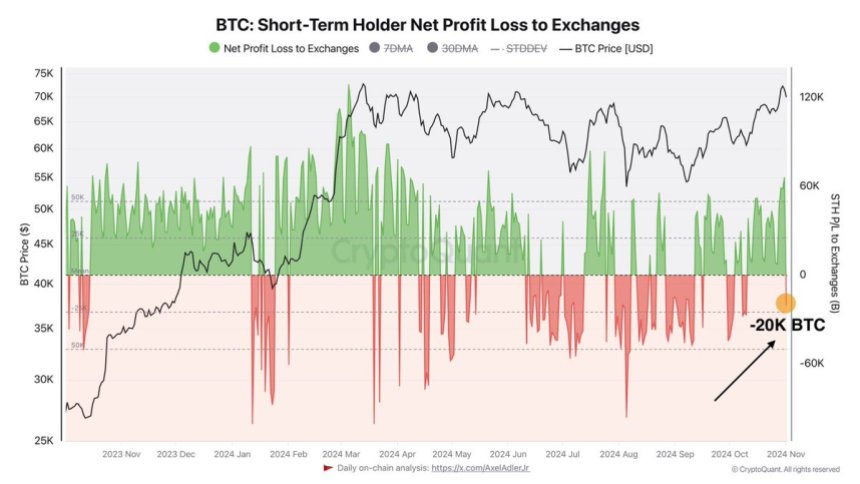
According to data from CryptoQuant, short-term holders are experiencing a net profit-to-loss of negative 20 BTC, indicating a wave of panic selling among retail investors. This type of behavior, often driven by fear, uncertainty, and doubt (FUD), can precede a significant price surge as stronger hands accumulate BTC at lower prices.
Historically, similar sell-offs by retail investors have been followed by renewed upward momentum as longer-term holders seize the opportunity to enter or reinforce their positions. If Bitcoin can maintain support above $69,000, the odds of a breakout past its all-time high increase substantially.
Market watchers are now closely monitoring the resistance level, as surpassing it could trigger a wave of buying interest and push BTC into new highs. The coming days may prove crucial, setting the stage for Bitcoin’s next big move.
Bitcoin Weak Hands Selling
Bitcoin recently attempted a breakthrough to new heights but failed to breach its all-time high of $73,794, entering a consolidation phase as the market eyes key events: next week’s U.S. election and the Federal Reserve’s anticipated interest rate decision.
CryptoQuant’s recent data, shared by analyst Axel Adler on X, points to a noteworthy trend among short-term BTC holders. The net profit-to-loss ratio for these holders shows a negative balance of -20 BTC, indicating a wave of panic selling following Bitcoin’s struggle to establish new highs. This sell-off among short-term investors, who tend to react more quickly to market volatility, suggests some caution amid uncertainty.

Adler emphasizes that in such turbulent times, a long-term “HODL” (hold on for dear life) approach can be the most beneficial strategy. Holding strong through market noise has historically rewarded BTC investors who keep their positions intact during periods of retracement and heightened volatility.
With Bitcoin’s all-time high in sight, a successful breakout would likely signal the beginning of a broad market bull run. The coming days are critical as Bitcoin sits at a pivotal point in its cycle, balancing between strong consolidation and the possibility of explosive growth.
The influence of the Federal Reserve’s decision on interest rates, paired with potential election outcomes, could create the market conditions needed for BTC to push past its all-time high. If this level is breached, it would not only affirm a bullish outlook for BTC but likely set off a rally across the entire cryptocurrency market.
BTC Holding Above Key Support
Bitcoin is currently trading at $69,620 following a retrace from its recent high near $73,600. Despite this pullback, bulls remain in control as BTC holds firmly above the crucial $69,000 support level—a price point that acted as resistance since late July. This level has now transformed into strong support, bolstering bullish sentiment in the market.

If Bitcoin holds above $69,000, a renewed push above all-time highs seems likely. Breaking this resistance would propel BTC into uncharted territory, potentially sparking a fresh wave of bullish momentum and price discovery. However, if the price dips below this mark, it could signal a need for a more significant correction to gather enough buying power for the next move up.
The $69,000 level serves as a key indicator of market confidence, as losing it would imply that BTC might temporarily seek lower support levels to attract new buyers and stabilize before another attempt at new highs. For now, Bitcoin’s price structure remains strong, and as long as this support holds, the market anticipates further upside momentum in the coming days. Bulls are closely watching this level, as it may define the next phase of Bitcoin’s bull run.
Featured image from Dall-E, chart from TradingView