30 October 2024
Bitcoin (BTC) is closing in on its all-time high (ATH), bringing excitement among bulls. However, seasoned analyst Peter Brandt advises caution, urging bulls to stay excited yet avoid becoming dogmatic.
Bitcoin Breakout Yet To Be Confirmed
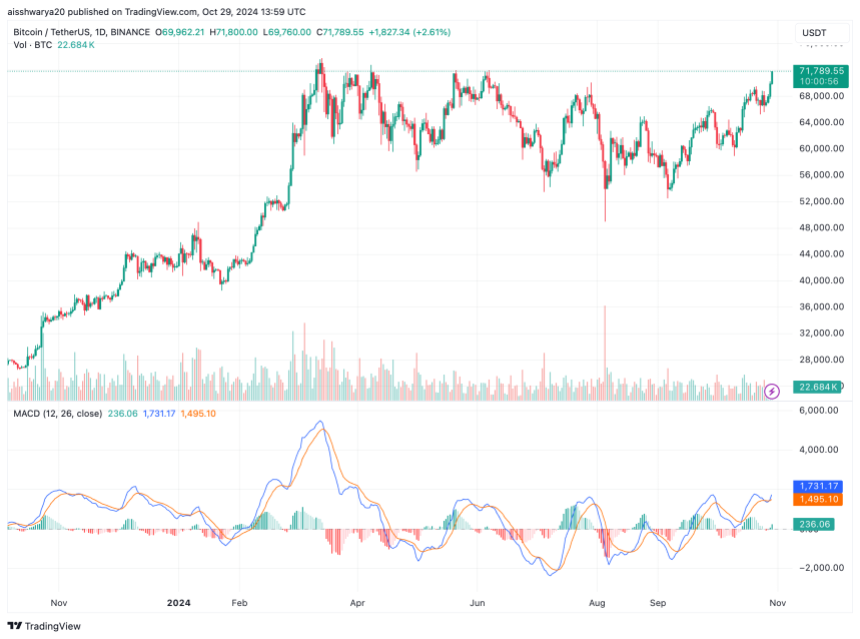
After a lackluster start to October – a historically bullish month for Bitcoin – the digital asset is exchanging hands at $71,789, just about 3% shy of its March 2024 ATH of $73,737.
While the prospect of a new ATH has the crypto market on its feet, veteran analyst and trader Brandt thinks multiple conditions must be fulfilled to determine a confirmed breakout.
In a post published on X on October 29, Brandt cautioned BTC bulls against over-enthusiasm without technical confirmation of a breakout.
Specifically, the analyst warned the bulls about the limitations of diagonal patterns – particularly those with slanted boundary lines – on trading charts.
Brandt explained that although “nicking” of a boundary line might excite the bulls, it does not represent a confirmed breakout.

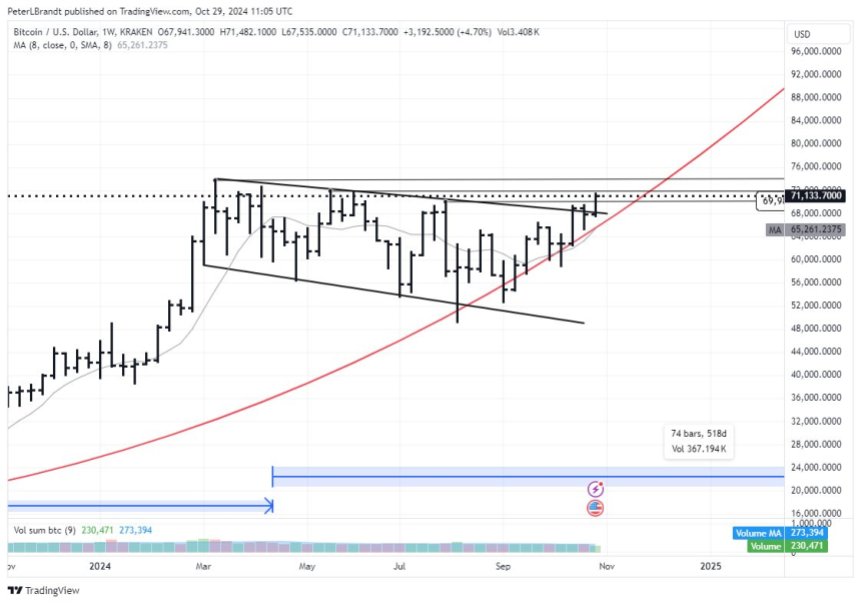
For a breakout to be genuine, Brandt has set the target price at $76,000, stating that Bitcoin’s daily chart needs to close above this level, with an average true range (ATR) measurement confirming this move above Bitcoin’s previous high set in March.
For the uninitiated, the ATR is a technical analysis indicator that measures market volatility by calculating the average of true price ranges over a set period, typically 14 days. It reflects how much an asset moves, helping traders gauge potential price fluctuations and set more informed stop-loss or profit targets.
Further, Brandt notes that such a breakout must be validated by a close on Sunday at midnight UTC, to ensure it is not a fake breakout that ends up trapping bullish investors.
On the weekly chart, Brandt highlighted that Bitcoin’s recent advance “has only nicked important chart points,” rather than breaking through with conviction.
The analyst concluded that BTC’s price has a substantial journey ahead before decisively forming a new support level.
Important To Overcome $71,000 – $73,000 Resistance Level
Another crypto analyst, 0xAmberCT, highlighted the significance of the strong resistance zone around $71,000 to $73,000. However, the analyst shared several reasons why this time might be different.
First, the high odds of victory for the Republican US presidential candidate Donald Trump might provide the much-needed fuel to the wider crypto market to start its Q4 2024 rally.
At the time of writing, Polymarket gives Trump a 66.5% chance of victory compared to Democratic candidate Kamala Harris’ 33.5%. A Trump win is a net positive for the digital assets industry.
In addition, the recent interest rate cuts by the US Federal Reserve (Fed) and the heightened prospects of a “soft-landing” are expected to increase the market’s risk-taking appetite. Risk-on assets like BTC are expected to benefit in a lower interest rate environment.
The analysts’ assessment aligns with Bitwise CIO Matt Hougan’s prediction that BTC may “melt-up” to $80,000 in Q4 2024.
However, crypto analyst Cole Garner recently shared that BTC might head lower before achieving a new ATH due to tightening on-chain liquidity. BTC trades at $71,789 at press time, up 4% in the past 24 hours.
