28 June 2025
In a post on 27 June, crypto-market chartist Dr Cat (@DoctorCatX) warned that Bitcoin’s ostensibly bullish weekly structure may be concealing a latent “time bomb” that could detonate if bulls fail to force a decisive breakout over the next three to four weeks. The technician’s diagnosis hinges on a classic Ichimoku paradox: an expanding bullish kumo and a flat Kijun Sen on the weekly timeframe are clustering with a constellation of bearish warnings on the daily and two-day charts.
Bitcoin Faces A July Time Bomb
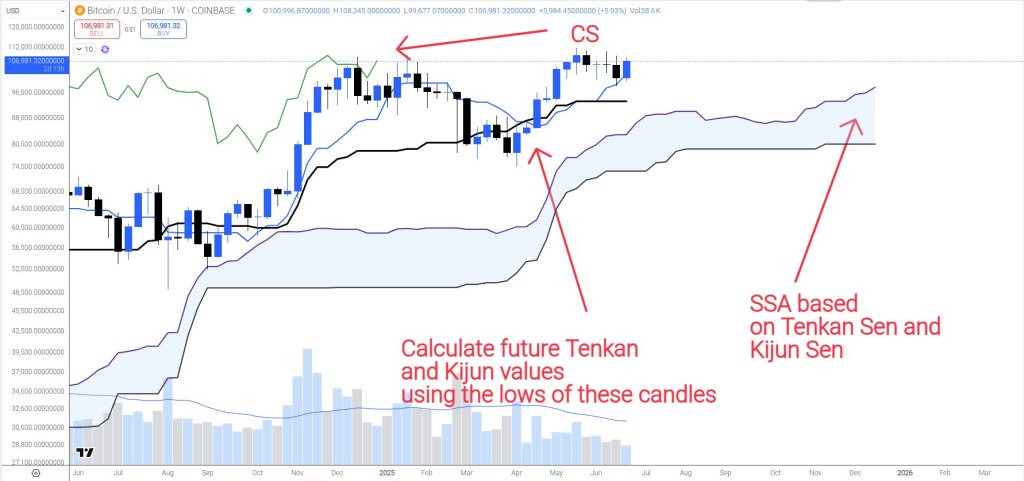
“Look at the weekly kumo: it’s expanding, widening,” Dr Cat began. “This means that bullish momentum is building for potential trend sustainability even though the trend is not active as Kijun Sen is flat.” The observation is significant because an enlarging kumo—formed by the Senkou Span A/B envelope—generally represents thickening support, making sudden breakdowns statistically less probable as long as the cloud keeps widening.
At the same time, the Chikou Span (CS) is “above the candles without a gap,” but, Dr Cat cautioned, it has “4 weeks deadline to close above ATH or will enter the candles.” Should the lagging line be absorbed back into price, the textbook interpretation is a loss of bullish conviction at the largest visible scale.

That ostensibly constructive weekly backdrop contrasts starkly with a “lot of red flags on the daily hinting for a bearish scenario which can escalate on many levels.” Among those alarms is the prospect of a death TK cross on the two-day chart, anticipated “tonight,” in which the Tenkan Sen slips below the Kijun Sen—often the prelude to a down-leg when it materialises beneath the cloud. “So how do you interpret such conflicting information from different timeframes?” the analyst asked rhetorically, underscoring that traders who privilege only a single interval risk being blindsided.
Dr Cat’s answer is a roadmap defined by time. Because the weekly cloud continues expanding, “it is hard for the price to dump a lot” immediately; historically, the kumo “needs first to become flat.” The flattening mechanism is mechanical: if Bitcoin fails to record a fresh all-time high “in 2 weeks from now,” roughly by the week that begins 14 July, the leading Senkou Span A numerator will stop rising, truncating cloud expansion. That in turn opens a window for gravity to reassert itself on the higher timeframe.
Against that backdrop the analyst offered two conditional trajectories. First scenario: bearish signals on the lower charts mature. “The price will likely need at least 1.5 month or so for a very big dump on the weekly scale, because the weekly kumo will keep expanding for 2 more weeks,” Dr Cat wrote.
During that holding period the market could “range around / just do small dumps to the $90s,” a reference to the high–$90 000 zone that has defined range lows since late spring. Should this grind continue beyond the second half of July without a structural shift on daily Ichimoku metrics, weekly momentum would invert: the kumo would cease expanding and the CS would dive into prior candles, removing two of the most durable layers of longer-term support.
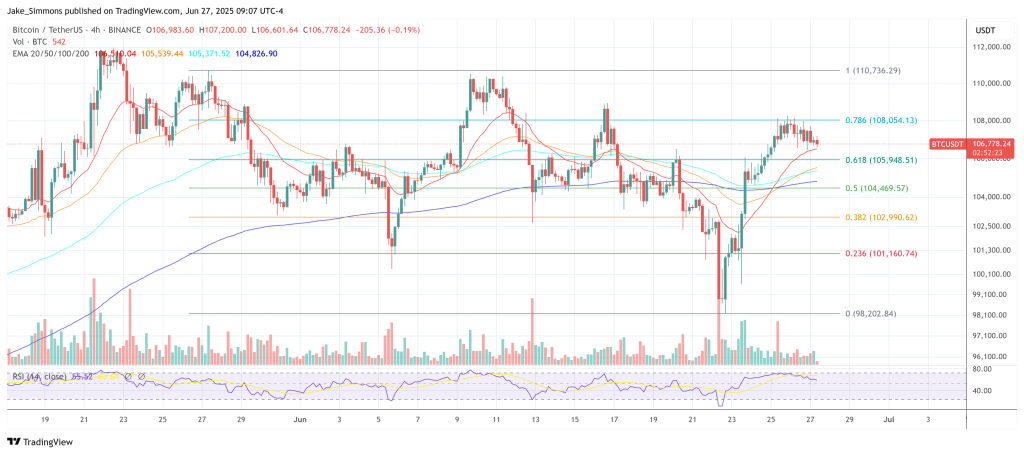
Second scenario: bulls seize the initiative. To “save the chart from the warning signs,” buyers must engineer “a higher high above the $110,600 high shortly after the 27th of June,” thereby invalidating the bearish daily setup and re-energising the top-down trend. Time is critical: after “the week starting on 14th of July,” the CS will approach prior candlesticks, making each subsequent failure to print a new high proportionally more damaging.
Dr Cat locates a final decision node on “the Sunday of the week starting on the 14th of July”—20 July—when the interplay between a stalling cloud and an in-candle CS could arm an additional set of “red flags for bulls.”
The post stops short of assigning explicit probability weightings to either outcome, but its construction implies that the market’s most consequential catalyst in mid-summer may not be macro data or ETF flows so much as a self-reflexive technical countdown visible to every chart-watcher who uses Ichimoku. With roughly three weeks remaining before the cloud loses upward curvature, participants must choose between forcing a breakout above $110,600 or bracing for a higher-time-frame correction that could test sub-$100 000 territory.
Whether Bitcoin’s expanding cloud proves a shield or a trap is, by Dr Cat’s own framing, “hidden in plain sight.” For now, the bullish weekly silhouette buys bulls breathing-room, but the daily and two-day warnings ensure that every hour the asset trades side-ways the theoretical time bomb ticks louder.
At press time, BTC traded at $106,778.
