24 November 2025
Bitcoin Magazine

Bitcoin Defends $84K Support Like a Champ: Oversold Bounce Targets $94K This Week
Bitcoin Bulls Stunned after Sellers Take Price All the Way Down to $80K
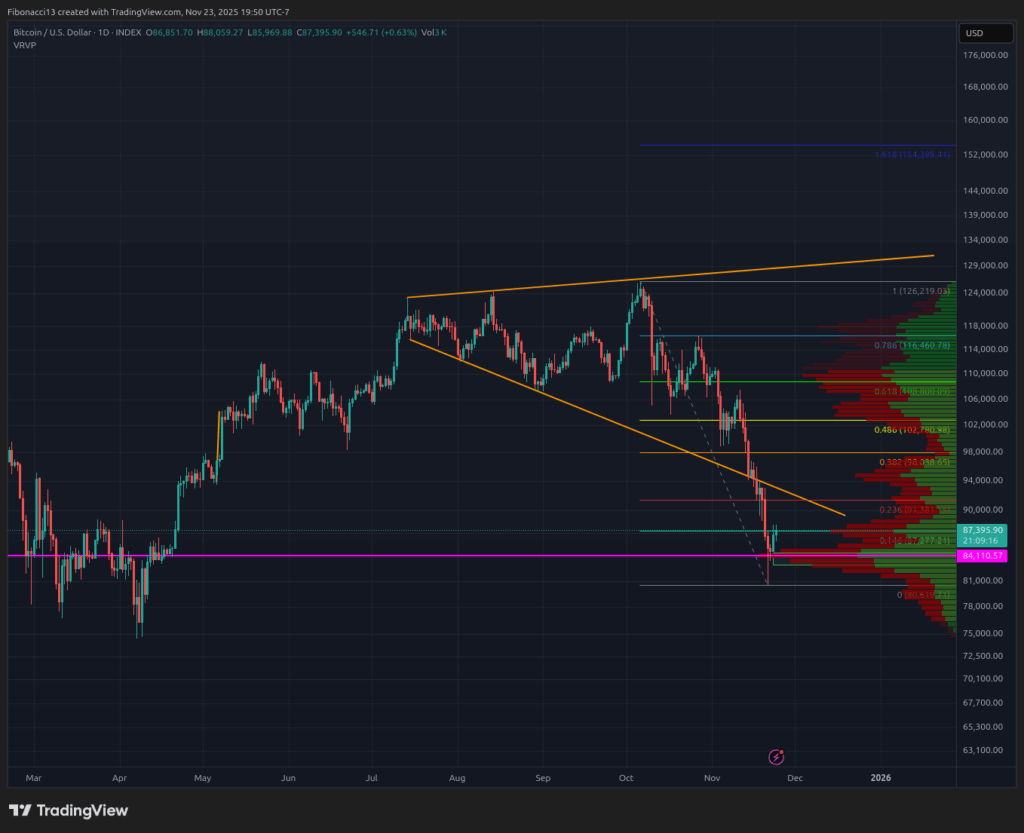
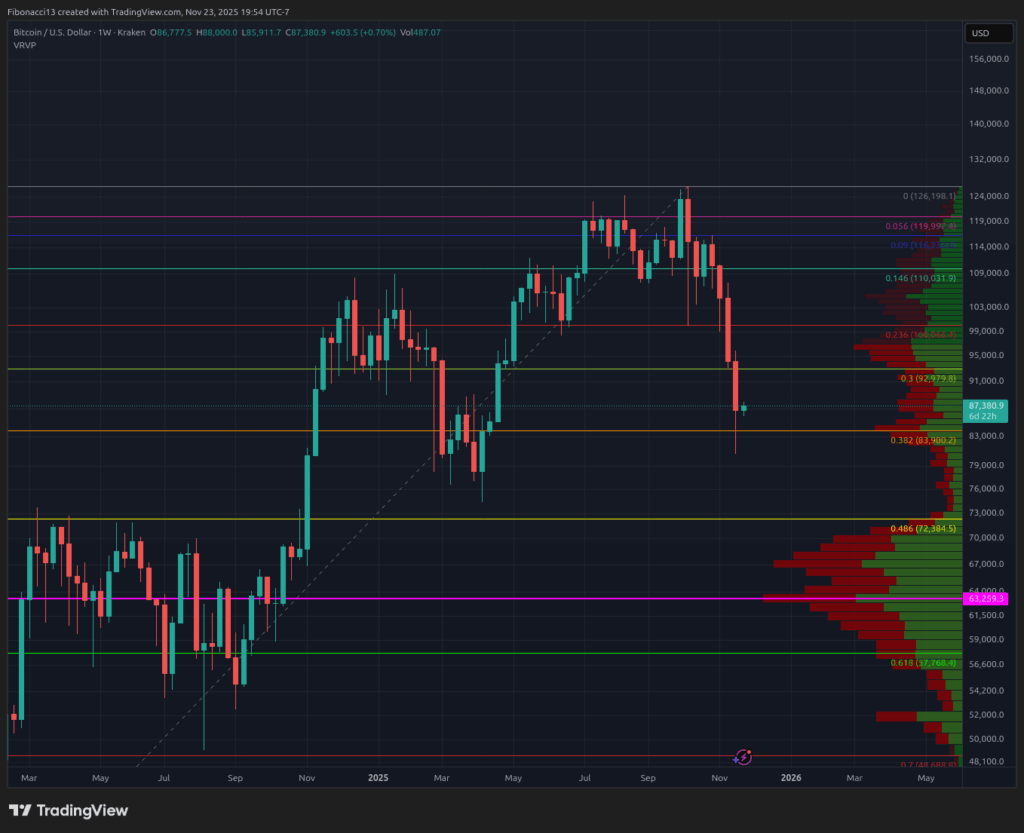
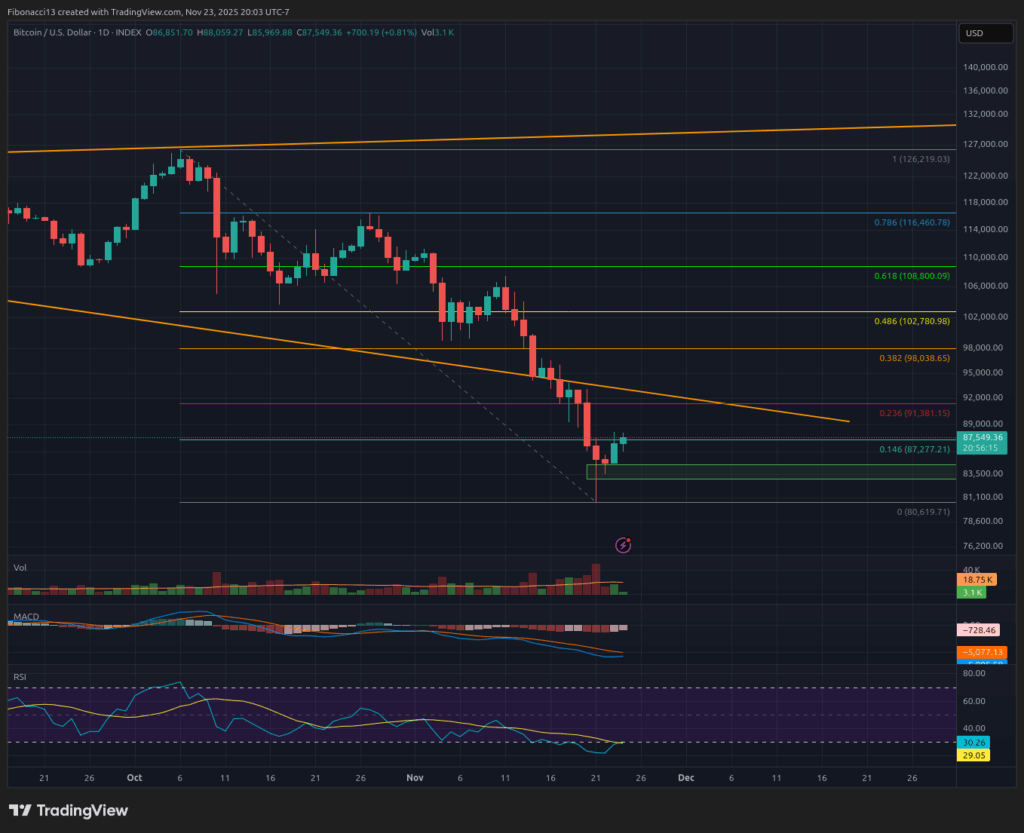
Last week, we identified the $84,000 area as the next major support for bitcoin, and that’s exactly where the price went. Bitcoin dropped to nearly $80,000 but managed to climb back above $84,000 support to close the week out at $86,850. Heading into this week, look for bears to let off the gas pedal a little bit as they sit comfortably in control of the price action. Daily oscillators were heavily oversold heading into this past weekend, so a bounce is in order at least into Monday, possibly a little further out.

Key Support and Resistance Levels Now
$84,000 Support held on the weekly close, so this is the level bulls will want to remain above into this week’s close. If $84,000 is lost, bulls look to $75,000, which likely won’t be too strong of a support level, and below there we’ve got a high volume support zone between $72,000 and $69,000. It’s difficult to see the price pushing below $70,000 too quickly, so expect some bounces from this area, even if it eventually fails to hold. Below here, we have the $58k gang support and 0.618 Fibonacci retracement at $57,700.
With last week’s price breakdown, resistance levels have now changed heading into this week. Bulls will look to take on the $91,400 resistance level at the 0.236 Fibonacci retracement first and foremost. Above here, we should see strong resistance at $94,000 now at the high volume node. If price can manage to grind through this zone, $98,000 sits above it as a final barrier to establish this high-volume node as support. If this occurs, there are still resistance levels at $103,000 and another at $109,000 at the 0.618 Fibonacci retracement. Finally, $116,500 remains as the last layer of resistance preventing the price from achieving new highs.

Outlook For This Week
Daily RSI hit very oversold levels on Friday last week, so it is not surprising that the price made a move up into the weekend from those lows. This week, look for the price to try to challenge the $91,400 resistance level and potentially $94,000 if it can climb above there. As long as the price can hold above $84,000, it should try to head for those target levels. With all the selling leading into last Friday, another big selloff should not be expected, but if the $80,000 low is lost, the price could drop to $75,000 this week.

Market mood: Extremely Bearish – The bulls are down on the canvas. Little hope remains for any meaningful rally or new highs after losing major support levels.
The next few weeks
The broadening wedge pattern we were watching for so many weeks finally and definitively broke to the downside last week. The target for this pattern is right around $70,000, so even if we see a rally this week and into the next, the price should eventually roll back over and head down to test $70,000. The US government, getting back to work last week, did nothing to assist the markets. In the coming weeks, it may be difficult to predict when economic data may or may not be available since much of it was delayed due to the shutdown. The market is mixed on whether or not the Federal Reserve will reduce interest rates at the next meeting, and they themselves seem to be conflicted between balancing inflation concerns with labor market issues.
Terminology Guide:
Bulls/Bullish: Buyers or investors expecting the price to go higher.
Bears/Bearish: Sellers or investors expecting the price to go lower.
Support or support level: A level at which the price should hold for the asset, at least initially. The more touches on support, the weaker it gets and the more likely it is to fail to hold the price.
Resistance or resistance level: Opposite of support. The level that is likely to reject the price, at least initially. The more touches at resistance, the weaker it gets and the more likely it is to fail to hold back the price.
Fibonacci Retracements and Extensions: Ratios based on what is known as the golden ratio, a universal ratio pertaining to growth and decay cycles in nature. The golden ratio is based on the constants Phi (1.618) and phi (0.618).
Volume Profile: An indicator that displays the total volume of buys and sells at specific price levels. The point of control (or POC) is a horizontal line on this indicator that shows us the price level at which the highest volume of transactions occurred.
High Volume Node: An area in the price where a large amount of buying and selling occurred. These are price areas that have had a high volume of transactions and we would expect them to act as support when price is above and resistance when price is below.
RSI Oscillator: The Relative Strength Index is a momentum oscillator that moves between 0 and 100. It measures the speed of the price and changes in the speed of the price movements. When RSI is over 70, it is considered to be overbought. When RSI is below 30, it is considered to be oversold.
Broadening Wedge: A chart pattern consisting of an upper trend line acting as resistance and a lower trend line acting as support. These trend lines must diverge away from each other in order to validate the pattern. This pattern is a result of expanding price volatility, typically resulting in higher highs and lower lows.
This post Bitcoin Defends $84K Support Like a Champ: Oversold Bounce Targets $94K This Week first appeared on Bitcoin Magazine and is written by Ethan Greene – Feral Analysis and Juan Galt.