1 October 2025
Bitcoin Magazine

FOMC Rate Cuts Loom as Bitcoin Holds Above $109,500 EMA
Bitcoin Price Weekly Outlook
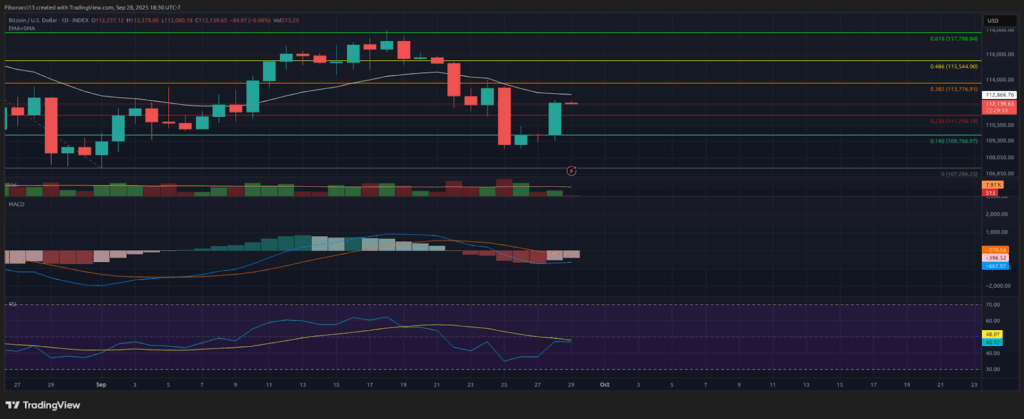
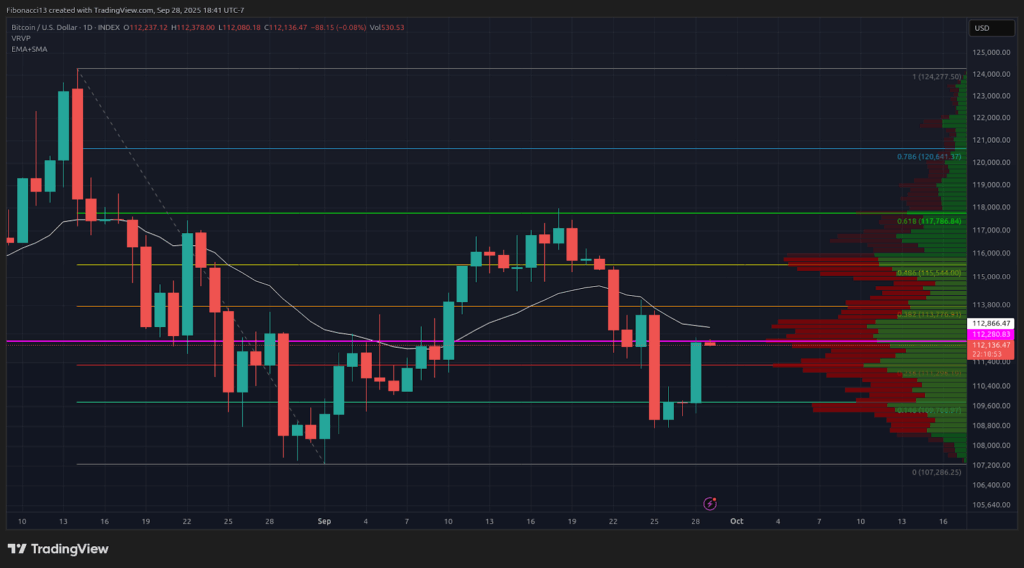
As highlighted in last week’s analysis, bitcoin had a big drop last Sunday night, down to $111,800. The price then bounced back to retest the $113,800 resistance level and the 21-day EMA at $114,000, but was rejected there, falling back down to the $111,300 support level. This level produced another bounce for the bulls back to the 21-day EMA, but was denied access again above the $113,800 resistance level, dumping down just below the weekly support at $109,500 on Thursday. Price rallied from that Thursday low to close the week out at $112,225.

Key Support and Resistance Levels Now
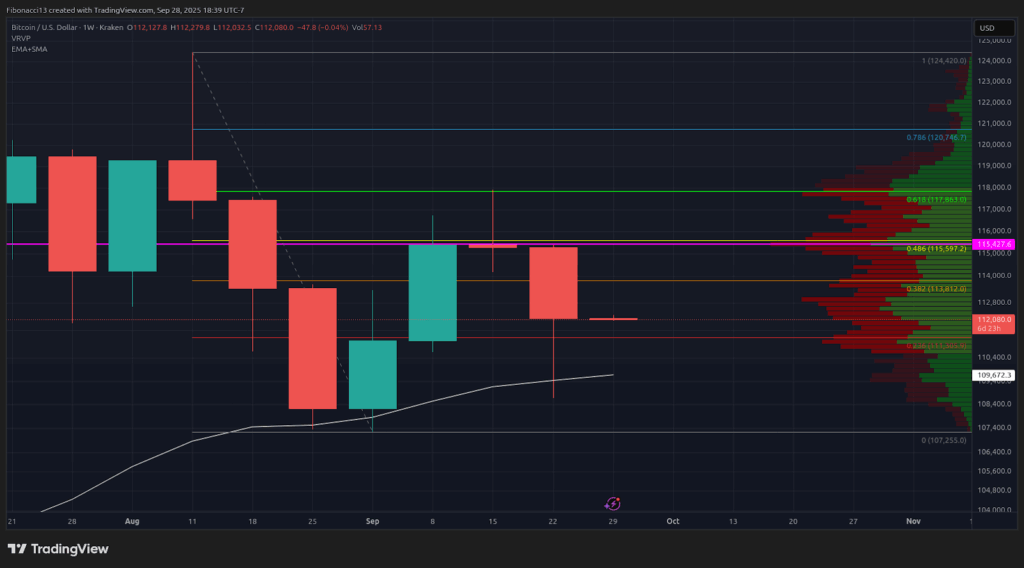
Since the price closed above the 21-week EMA at $109,500 to finish the week, the bulls will look for this support to hold going forward. $109,500 should be the floor heading into this week if the bulls are to produce a weekly higher low and turn things around. $105,000 is the next support level down, and there is potential for a major reversal from there down to about $102,000. Losing $102,000 opens the door down to major long-term support, at $96,000.
On the upside, bulls will look for the price to close above the $115,500 resistance level to re-establish the uptrend. This would provide confidence for the bulls to tackle the $118,000 resistance once again and likely move above it. $121,000 sits above here as the gateway to new highs, but likely won’t hold for long if we get a weekly close above $118,000.

Outlook For This Week
Look for price to re-test the $109,500 low early in the week, with potential to secure this level as support for a bullish move back up to $113,800. It would likely take very strong buying pressure to push above the $115,500 resistance level this week, so expect this level to keep a lid on things if $113,800 can be conquered. Bulls will look to put in a green candle this week to confirm last week as a higher low.
Bias is still bearish on the weekly chart, however, so we should anticipate the $113,800 resistance level to hold over the short term. Losing $109,500 on the daily chart could lead to another big price drop this week, down to new lows, testing the $105,000 to $102,000 support zone.

Market mood: Bearish — with a big red candle to close the week out, the bears are firmly in control. The bulls will need to come out strong this week to defend the 21-week EMA support.
The next few weeks
The weekly chart is still bearish until proven otherwise. Bulls must tilt the bias back in their favour to foster more positive price action going forward; it is possible for them to do that with a strong close to end this week. With September’s interest rate cut now behind us, markets will be looking for more rate cuts into the October and December FOMC meetings to keep capital flowing. Investors will be eyeing US financial reports closely over the coming weeks for data supportive of further cuts. Any impediments to further cuts in the data will likely result in more bearish price action and further selling.
Terminology Guide:
Bulls/Bullish: Buyers or investors expecting the price to go higher.
Bears/Bearish: Sellers or investors expecting the price to go lower.
Support or support level: A level at which the price should hold for the asset, at least initially. The more touches on support, the weaker it gets and the more likely it is to fail to hold the price.
Resistance or resistance level: Opposite of support. The level that is likely to reject the price, at least initially. The more touches at resistance, the weaker it gets and the more likely it is to fail to hold back the price.
EMA: Exponential Moving Average. A moving average that applies more weight to recent prices than earlier prices, reducing the lag of the moving average.
This post FOMC Rate Cuts Loom as Bitcoin Holds Above $109,500 EMA first appeared on Bitcoin Magazine and is written by Ethan Greene – Feral Analysis.